


20 Years of the Department of New Media Art at the Academy of Fine Arts in Kraków ( PJAIT )—join us for the anniversary exhibition!


Companies collect information about sales, customers, costs, logistics, campaigns, and team performance. However, data alone does not solve problems. Only by organizing, combining, and properly interpreting that data can we see what is happening within the organization and where action is needed. This is the purpose of Business Intelligence, or BI for short.
That said, Business Intelligence is not a single program or a flashy chart presented during a board meeting. It is a combination of processes, data architecture, business rules, analytical methods, and tools that help transform scattered information into knowledge useful for decision-making.
Simply put, Business Intelligence is a structured approach to answering business questions using data. Such questions might include “How have sales changed in the last quarter?” or “In which region are delivery costs rising?”, “Which products are most often added to a single shopping cart?” or “Why has the number of customer cancellations increased despite higher marketing spending?”
BI helps make the transition from intuition to verifiable evidence. Of course, it does not replace a manager’s experience or make decisions for them. Instead, it provides a shared view of the situation, allows deviations to be spotted more quickly, and reduces the risk of discussions based on a few conflicting spreadsheets.
The term BI, short for Business Intelligence, is sometimes used as a full form of the acronym in educational materials, job descriptions, and project documentation. The term “BI IT,” on the other hand, emphasizes the technological aspect of this field—namely, system integration, databases, modeling, access control, processing automation, and maintenance of the analytical environment. However, BI remains a field that combines information technology with organizational knowledge. Without an understanding of business processes, even a technically correct report may answer the wrong question.
The dashboard is the most visible component of a Business Intelligence system, but it is only its top layer. It all starts with data from multiple sources, such as sales systems, ERP and CRM systems, web applications, transactional databases, spreadsheets, devices, files, and external APIs. The data is then retrieved, cleaned, standardized, and integrated. At this stage, among other things, duplicates are eliminated, missing values are filled in, and issues related to different date formats or varying definitions of the same concepts are resolved.
After this preparation, the information is sent to the storage layer—for example, a data warehouse, a data mart, or a modern cloud platform. These solutions store historical data and are designed primarily for analysis, not just for processing day-to-day transactions. The next component is the semantic model, which translates technical tables and columns into language that is understandable to the business. It defines agreed-upon metrics, relationships, hierarchies, and KPIs, such as margin, customer acquisition cost, and on-time delivery.
Ultimately, we end up with a report, a dashboard, an alert, or tools for self-guided data exploration. Here, we can filter results, compare time periods, and drill down from a general overview to detailed data. However, the presentation of information alone is not the goal of BI—the system’s value becomes apparent when the analysis leads to a specific decision, such as a budget change, a process adjustment, a modification to an offering, restocking, or a more thorough investigation of a detected problem.
The data preparation process is often described by the acronym ETL: extract, transform, and load. In more modern architectures, the ELT approach is also used, in which transformations are performed after the data has been placed on the target platform. Regardless of the order, quality, consistency, and the ability to trace the origin of the information remain key.
A good Business Intelligence system shouldn’t just create visually appealing visualizations. It must also ensure that data is up-to-date, that metric definitions are standardized, that appropriate permissions are in place, and that users can verify the source of a given number. If the sales department defines an “active customer” differently than the finance department, a shared dashboard won’t resolve those discrepancies. First, the meaning of the data must be agreed upon.
Microsoft Power BI is one of the platforms used for Business Intelligence tasks. The official description of Microsoft Power BI presents this solution as a scalable platform that supports both self-service analytics and enterprise-level BI. It enables users to combine data, build models, create interactive reports, and share results.
The question “What is Power BI and what is it used for?” often comes up when people first start learning data analysis. In fact, it’s an environment where you can retrieve data from multiple sources, prepare it, define relationships and metrics, and then present the results in the form of a report. Visual elements can respond to user selections, filter each other, and lead to more detailed views.
However, simply knowing the program’s interface is not enough to create a good solution. You also need skills in data modeling, formulating questions, selecting metrics, and designing clear visualizations. A poorly defined margin will remain inaccurate regardless of the quality of the chart.
In addition to Power BI, the market offers a variety of other BI tools, including Tableau, Qlik Sense, Looker, SAP Analytics Cloud, and open-source solutions. They differ in terms of deployment models, integrations, licensing models, management capabilities, and the level of flexibility in creating analyses.
The BI ecosystem also includes tools that are invisible to the report recipient—such as database systems, data integration platforms, cloud data warehouses, data catalogs, ETL or ELT tools, and quality control mechanisms. Therefore, choosing a visualization platform is just one of the design decisions. First, you need to determine user needs, data availability, security requirements, and the scale of the solution.
Business Intelligence is best illustrated with an example, and a good one here would be an online store that notices a decline in profitability despite a growing number of orders. Data on average cart value is stored in the e-commerce platform, campaign costs in advertising systems, returns in the warehouse management application, and delivery fees in the logistics company’s system.
The BI solution integrates these data sources and allocates costs to orders, products, channels, and customer segments. The report shows that the campaign increased sales in a low-margin category, and that orders included in the promotion were more likely to require expensive shipping and were returned more frequently. The problem, therefore, is not a lack of demand, but rather an unfavorable combination of discount, fulfillment costs, and shopping cart composition.
Based on such a request, the team can change the terms of a promotion, the free shipping threshold, or the campaign’s target audience. That’s the difference between reporting and useful BI. A report simply states what happened, while well-designed analytics help you understand the mechanism and identify areas for action.
A similar approach can be applied in many sectors, ranging from manufacturing—where it enables the monitoring of downtime, quality, material consumption, and on-time delivery—to telecommunications and finance, where it supports the analysis of service utilization, network load, costs, liquidity, and risk. It is also useful in logistics for evaluating routes, inventory, delays, and delivery costs, and in education and administration for tracking progress, resource utilization, process effectiveness, timeliness of tasks, and service availability.
These concepts overlap to some extent, but they emphasize different objectives. Business Intelligence typically focuses on monitoring the situation, analyzing current and historical data, and providing consistent metrics. It helps answer questions such as what happened, where a change occurred, and what factors may be related to it.
Business analytics, on the other hand, starts with the organization’s needs. It involves identifying problems, analyzing processes, working with stakeholders, defining requirements, and evaluating possible solutions. A business analyst may use BI, but their work is not necessarily limited to data or reports.
Data science, on the other hand, more often uses statistics, programming, and machine learning to build predictive or optimization models. It can answer questions about likely demand, the risk of customer churn, or the best course of action. The boundaries between these fields are not rigid; modern BI platforms increasingly include AI capabilities, and model results can be fed directly into dashboards.
It is also important to distinguish between self-service BI and centrally managed BI. The former gives business users the freedom to create analyses. The latter places greater emphasis on shared models, access control, quality, and consistent definitions. A mature organization typically combines both approaches rather than choosing just one.
Business Intelligence is a good example of an area where technical and business skills complement each other. Depending on the role, the most useful skills include knowledge of SQL and working with databases—including retrieving, combining, and aggregating information—as well as data modeling, which involves designing relationships, measures, and structures that facilitate analysis. Data preparation, error detection, standardization, and documenting transformations are also important. Data visualization—that is, selecting the appropriate form of presentation for a specific question and audience—also plays a significant role.
Equally important is an understanding of business processes, which allows one to identify which metrics truly describe the organization’s operations. A BI specialist should also be able to communicate with stakeholders, define requirements, clearly explain results, and translate analyses into useful conclusions. Knowledge of data governance principles—including access control, data ownership, and the use of common definitions—is valuable. Critical thinking is also key, as is distinguishing between correlation and causation, and regularly verifying the quality of the data and the conclusions drawn from it.
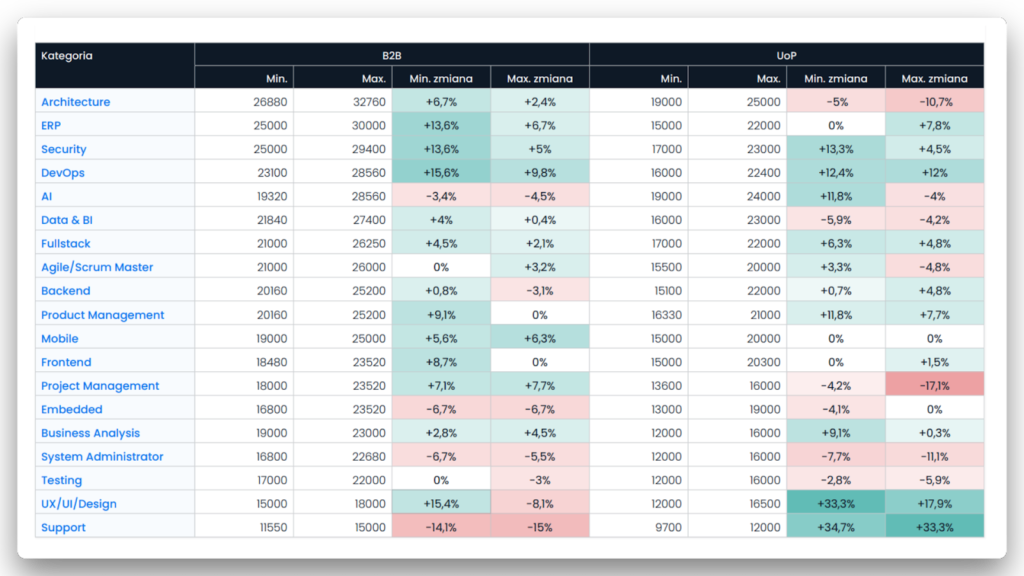
The No Fluff Jobs report—“The IT Job Market 2025/2026”—highlighted an increase in the number of job openings, but also noted that recruitment efforts were primarily focused on experienced professionals. The aforementioned requirement for SQL proficiency—one of the key technologies for working with data and BI solutions—appeared in 22.3% of the job postings analyzed.
The same report also shows that such broad requirements are offset by high salaries in the Data & BI category. The salary ranges offered were from 21,840 to 27,400 PLN net for B2B contracts and from 16,000 to 23,000 PLN gross for employment contracts.
A good first project doesn’t have to be a complex data warehouse at all. A small dataset related to sales, transportation, or application performance—on which you can run the entire process—is sufficient. So, first and foremost, formulate a business question, check the structure and quality of the data, prepare and document the transformations, build a simple model, define a few unambiguous metrics, design a report tailored to the audience, and finally, document the conclusions and limitations of the analysis.
A project like this teaches not only how to use BI tools, but also how to take responsibility for the entire flow of information. It’s a good idea to document your decisions—for example, why certain records were rejected, how an “active customer” was defined, and how often the data should be refreshed.
Those interested in combining technology, management, and analysis can visit field of study .Information Management atPJAIT. The program combines knowledge from the fields of computer science, economics, and management, and an important part of the curriculum focuses on using information to support organizational operations and strategic decision-making.
For those working at the intersection of processes, products, and technologies, the postgraduate program in Project Management, Product Management, and Business Analysis Using AI is an interesting option. Their area shows that data and AI do not operate in a vacuum; they must be embedded within requirements, processes, communication with stakeholders, and the realities of the project.
On the other hand, those who wish to gain a better understanding of the technical foundations of analytical solutions can enroll in the part-time postgraduate program “Databases and Their Applications.” The curriculum covers, among other topics, SQL, database and data warehouse design, OLAP, and the development of business intelligence solutions.
BI streamlines the path from data to decisions. It combines technical infrastructure with an understanding of processes, and reporting with the ability to ask the right questions. A dashboard may be the result of this work, but its foundations are reliable data, consistent definitions, a well-designed model, and an informed audience.
As AI continues to advance, some of the tasks involved in preparing analyses, identifying correlations, and describing results will become increasingly easy to automate. However, the need to assess data quality, understand context, and responsibly translate observations into action will not disappear. This is precisely why Business Intelligence remains not only a set of tools but also a vital competency at the intersection of business and IT.